Ever wondered which mix of stocks would have given you the best return over time? That’s exactly what the Portfolio Optimizer helps you figure out. Whether you’re building a new portfolio or fine-tuning an existing one, this tool takes the guesswork out and replaces it with data.
Step 1: Add Your Stocks
Start by entering the tickers of the stocks you’re considering. Just type them into the search bar and hit “Add.” Once added, they’ll show up on your list—ready to be included in your optimized portfolio.
Step 2: Choose a Timeframe
Next, select the time period you want to analyze. You can choose from recent months, the past year, five years, or even custom date ranges—whatever suits your investment goals. This lets you see how different stock combinations would’ve performed over your chosen timeframe.
Step 3: Customize the Optimization
Now for the fun part. Tell the tool how many portfolios to generate. Each one will be a different blend of the stocks you've selected, with varying weightings. One might be 70% Apple and 30% Google; another could be 15% Apple, 25% Tesla, and 60% Google.
You can also define how many stocks each portfolio should include. For instance, if you want at least 3 and no more than 5 stocks in any portfolio, the optimizer will build combinations that respect those limits—helpful if you have a list of 10 stocks but only want to focus on the top-performing mixes.
Step 4: Set Your Investment Amount
Enter how much you plan to invest. This gives the optimizer context for its calculations and makes the results more actionable.
Step 5: Optimize and Compare
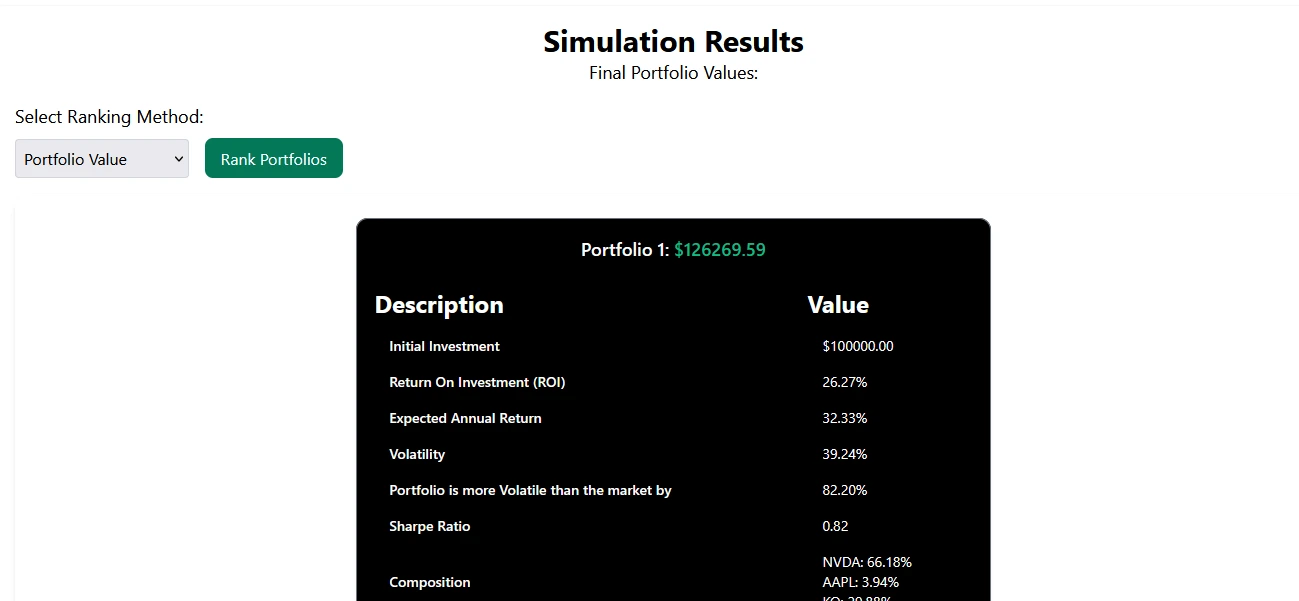
Click “Optimize Portfolio” and let the tool crunch the numbers. Within seconds, you’ll see a ranked list of portfolios—starting with the one that delivered the highest return over your selected period.
Want to factor in risk? No problem. Use the dropdown menu to switch to “Best return for risk,” then click “Rank Portfolios.” This reorders your results based on the Sharpe ratio, which balances return against volatility.
Dive Into the Details
Click any portfolio to see a full breakdown:
-
Total return
-
Expected annual return
-
Volatility (compared to the S&P 500)
-
Sharpe ratio
-
Stock-by-stock investment allocation
These insights give you a clear, data-backed view of where your money could go.
🚀 Ready to find your ideal stock mix? Try the Portfolio Optimizer now and start building smarter, more effective portfolios in minutes.
Bonus: Stress Test with Monte Carlo Simulation
Want to see how a portfolio might hold up under different market conditions? Run a Monte Carlo simulation to test future performance across thousands of possible outcomes. It’s a great way to understand potential risks before committing.
📊 Curious how your portfolio might perform in the future? Put it to the test with our Monte Carlo Simulator and explore the possibilities.
Whether you’re a hands-on investor or just want some help picking the right stock mix, the Portfolio Optimizer and Monte Carlo tools give you a smarter, data-driven way to invest. Give them a try and see what your portfolio could be capable of.